


This post by Economics Today co-editor Peter Maunder is written to complement the “Economics Super Curriculum” feature by Cathy Williams in November 2026’s Economics Today.
Economics Today is the essential applied economics magazine for students and teachers at A-level and beyond. Now in its 33rd year, circulation or our print version is on the up! No mean feat in today’s digital world.
You can get your subscription here: https://economicsfactory.com/product/economics-today-volume-33-2026-27-print-edition/
The IS-LM model
The November issue of Economics Today contains an article by Cathy Williams on the macroeconomics model which brings together the goods market (IS) and the financial markets (LM). This model was the creation of Sir John Hicks who was a contemporary of John Maynard Keynes, nearly 90 years ago. Cathy Williams explained the model and stated that some economists feel it is too simplistic since it ignores several real-world issues like productivity growth, expectations and price inflation.
From this author’s experience teaching this model, students feel the intersection of the IS and LM curves is self-evidently the equilibrium point but struggle to explain why other points on the diagram cannot achieve that equilibrium. So here is an explanation with reference to the attached Figure.
Question: Why is point labelled C on the Figure a disequilibrium one?
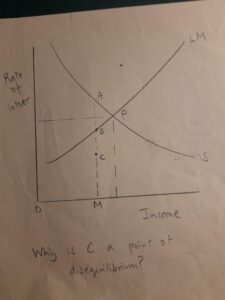
Clearly in the Figure, point C is in terms of the rate of interest measured on the vertical axis less than the interest rate at point P. Likewise, point C is at a level of income less than that at point P.
Let us first take the IS curve
At the level of income OM corresponding to point C, the rate of interest is much lower than that at point A on the IS curve. The model assumes that investment is a function of the rate of interest. Thus, with investment being greater than savings, there must be a move to the right from point C .
We now turn to the LM curve
At the level of income, OM point B shows where the money market is in balance. This point B is at a level of interest rate higher than at point C.
The model assumes the demand for money is interest elastic as Cathy Willims article shows at Figure 5. The supply of money is assumed to be constant. Given the liquidity preference function of the demand for money, the demand for money being greater than the supply of money there will be a rightward movement in the level of income.
So with reference to points C and A we can see there must be a movement towards the equilibrium point of P.
The same explanation is relevant to any other point in the Figure.
Further Reading
Back in 2005 the then anonymous economics editor of The Economist revealed that study of the IS-LM model had been part of undergraduate study of macroeconomics in the 1970s. Like Cathy Williams, the writer stated that the model had ” gone out of fashion” but claimed it was “more relevant than ever” in 2005.
See ” Economics Focus: A Working Model “, The Economist, 13 August 2005, p.63.

